Industry Standards for 2026
Last updated: April 2026
Understanding how much of your revenue should go toward rent is critical when evaluating commercial space. If you’re actively searching, you can browse available office space for rent to compare real-world pricing against these benchmarks.
General guideline: A widely cited industry rule of thumb holds that most stable businesses keep rent at 5%–10% of gross revenue. Exceeding 15% may indicate unsustainable occupancy costs. (Guidance consistent with SCORE, SBA, and CBRE commercial advisory resources.)
Disclaimer: These are general benchmarks. Actual affordability depends on your margins, industry, and lease structure.
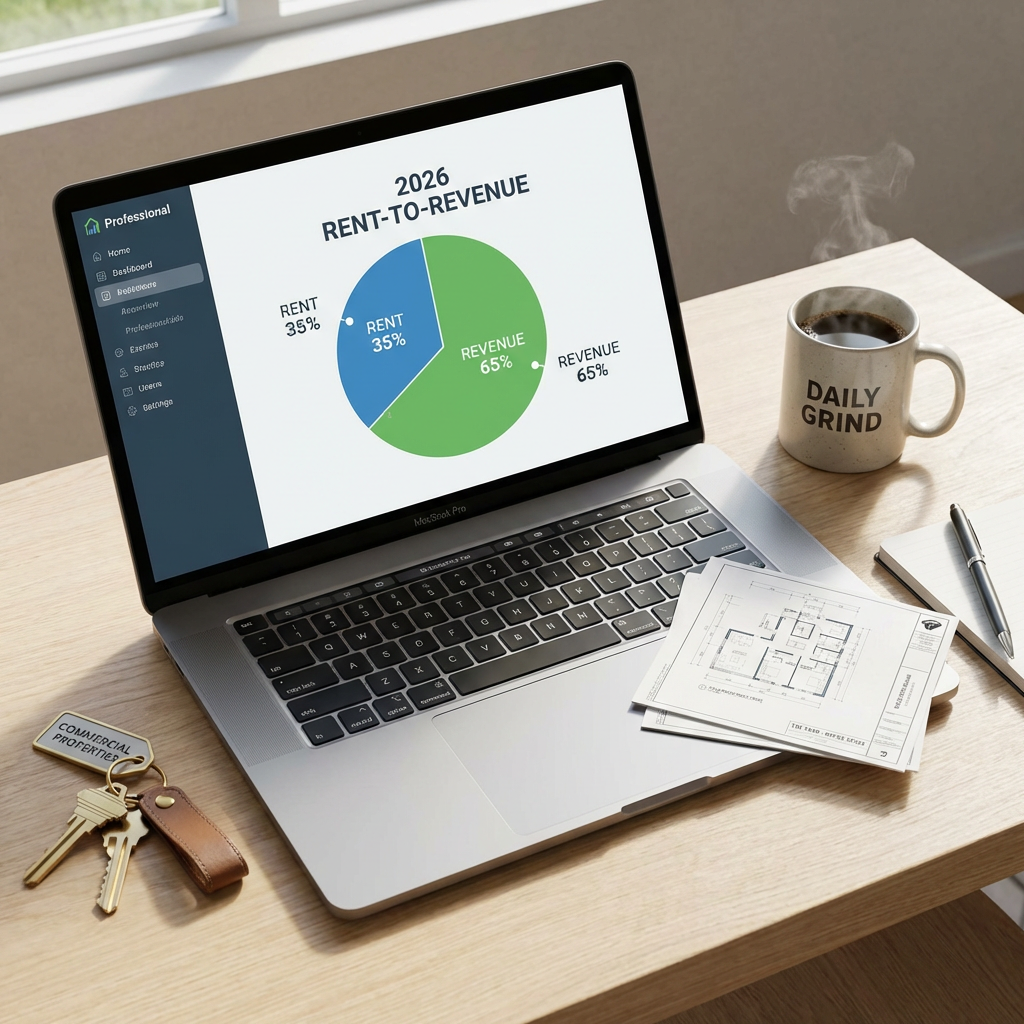
Understanding Rent-to-Revenue Ratios
The rent-to-revenue ratio measures how much of your gross income is spent on occupancy.
Formula:
Annual Rent ÷ Gross Annual Revenue = Rent Percentage
Example:
- Annual Rent: $24,000
- Annual Revenue: $300,000
- Rent Ratio: 8%
This means 8 cents of every dollar earned goes toward rent.
- Keeps overhead predictable
- Protects profit margins
- Helps determine affordability before signing a lease
Most small to mid-sized businesses should aim to stay under 10%. If you’re unsure how your numbers compare, consider reviewing current commercial listings to benchmark pricing in your target market.
Commercial Rental Rates Explained
Commercial rents are typically quoted as price per square foot per year.
Example: “$25/SQFT” means $25 per square foot annually.
Estimate your cost:
- Multiply rate × square footage
- Divide by 12 for monthly rent
Rule of thumb: Allocate ~100 square feet per employee.
Additional costs may include:
- Utilities
- Maintenance
- Common area fees
- Property taxes (depending on lease)
These costs vary significantly by building and location. Reviewing specific property listings like One Barney Road can give you a clearer picture of real occupancy expenses.
Types of Commercial Leases
- Gross Lease: Flat rent; landlord pays operating expenses
- Net Lease: Rent + portion of expenses
- Double Net (NN): Rent + taxes + insurance
- Triple Net (NNN): Rent + taxes + insurance + operating costs
- Percentage Lease: Base rent + % of sales
- Step-Up Lease: Scheduled rent increases over time
Always evaluate total occupancy cost, not just base rent. If you’re comparing lease structures, start with available commercial leasing options in your area.
Usable vs. Rentable Square Footage
Usable Square Footage (USF): Space exclusively used by your business.
Rentable Square Footage (RSF): USF plus shared building areas.
Most leases are based on RSF, meaning you pay for common areas as well.
Loss Factor (Load Factor)
The loss factor represents the difference between usable and rentable space.
(RSF – USF) ÷ RSF
Benchmarks (per BOMA guidelines; varies by building class and market):
- Typical: 10%–25%
- High: 25%–40%
- Above 40% is excessive
If you’re evaluating multiple properties, comparing loss factors across available office spaces can reveal hidden cost differences.
Industry Benchmarks (2025–2026)
| Industry | Typical Rent % |
|---|---|
| Restaurants (F&B) | 6% – 10% |
| Retail | 5% – 8% |
| Professional Services | 4% – 8% |
| Service Businesses | 3% – 7% |
| High-Volume Retail | Up to 12% |
Ranges reflect base rent only and exclude CAM charges. Figures are illustrative, based on commercial real estate advisory guidance from sources including CBRE, Cushman & Wakefield, and NAIOP. Verify current conditions with a licensed broker for your market.
Build-Out and Tenant Improvements
Most spaces require customization before use.
- Interior construction
- Electrical/plumbing upgrades
- Layout redesign
Landlords may offer:
- Tenant improvement allowances
- Free rent during build-out
Some properties already include build-out-ready layouts—see available suites at One Barney Road for examples.
How to Calculate Your Maximum Rent
- Estimate annual revenue
- Apply target percentage (e.g., 8%)
- That result is your max rent
Example:
- Revenue: $500,000
- Target: 8%
- Max Rent: $40,000/year (~$3,333/month)
Example Calculation
- Monthly Rent: $1,000
- Annual Rent: $12,000
- Annual Revenue: $240,000
12,000 ÷ 240,000 = 0.05 (5%)
This is a healthy rent-to-revenue ratio.
When Rent Becomes Too High
- Exceeds 12%–15% of revenue
- Margins begin shrinking
- Fixed costs become difficult to cover
High-volume retail and food service operations may sustain ratios up to 12% due to higher revenue velocity. For most business types, the 5%–10% range is the general target. Beyond 12%–15%, margin risk increases significantly.
Solutions may include renegotiation, downsizing, or relocation. You can explore alternative options through our commercial property listings.
Final Takeaway
Your rent should support your business—not strain it.
Before signing a lease:
- Calculate your rent-to-revenue ratio
- Understand total occupancy costs
- Evaluate lease structure carefully
Ready to take the next step? Browse available office and retail space or review featured properties to find a space that fits your budget.